Overview
The AgileBlue portal provides clear, at-a-glance visibility into the health of your integrations directly from the Dashboard and Device Details pages. For devices checking in as Cloud Platforms, Productivity, or Cloud Apps, you can now view integration status indicators and, when applicable, detailed error messages pulled directly from Elastic.
Prerequisites
-
An active AgileBlue portal account with appropriate access
- At least one configured integration checking in as a Cloud Platform, Productivity app, or Cloud App
Viewing Integration Status on the Dashboard
-
Log in to the AgileBlue SecOps Portal
-
From the main navigation, go to the Dashboard
-
Locate the Monitored Applications section
-
Review the Integration Status column:
-
A green check mark indicates the integration is configured, checking in, and returning no errors
- A red X indicates the integration has one or more errors within Elastic
-
Viewing Integration Status on the Device Details Page
Note: The updated Device Details page applies only to devices checking in as Cloud Platforms, Productivity, or Cloud Apps.
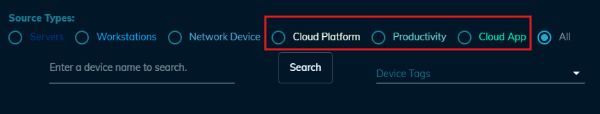
- From the Data Sources page, click on the name of an integration checking in as a Cloud Platform, Productivity app, or Cloud App. To the right of the clickable name, there will also be columns that show the status of the Elastic Agent, Elastic Endpoint, and Fleet statuses.
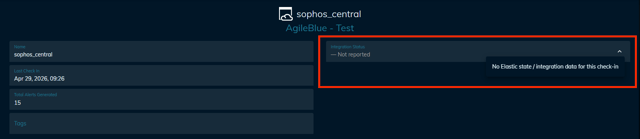
- Review the information displayed. The following fields are shown on this page:
- Name
- Last Check-In
- Total Alerts Generated
- Tags
- Integration Status
- Locate the Integration Status indicator:
Status: Healthy
- The status box displays as Healthy with a green indicator
- Select the dropdown status box to view the status details
- The status will confirm: Healthy - No action required
Status: Attention Required
- The status box displays as Attention Required with a red indicator
- Select the dropdown status box to view the status details
- The dropdown will display the exact error message returned from Elastic
- Use the error message details to investigate and resolve the integration issue
Status: (Grey Dash)
-
The integration status is not available for the last check-in
- Note: This status updates every 4 hours and may take up to 4 hours for the status to become available
Need Help?
AgileBlue is always here to support you and ensure you are 100% successful. If you have any questions or encounter any issues, please reach out to AgileBlue Support.
Email: support@agileblue.com
Phone: (216) 606-9400